Debugging
console.log
It is good to include console.log() lines to server side application when it is in development. This is one of the easiest way to detect what may cause the problems.
In a below code console.log is used inside a POST request to persons route. A new person data is sent to server side with request.body.
1 2 3 4 5 6 7 | |
You can use for example VS Code to send a POST request to your server. Request have successfully fullfilled in a below figure and server has send status code 200 with person data in JSON format.
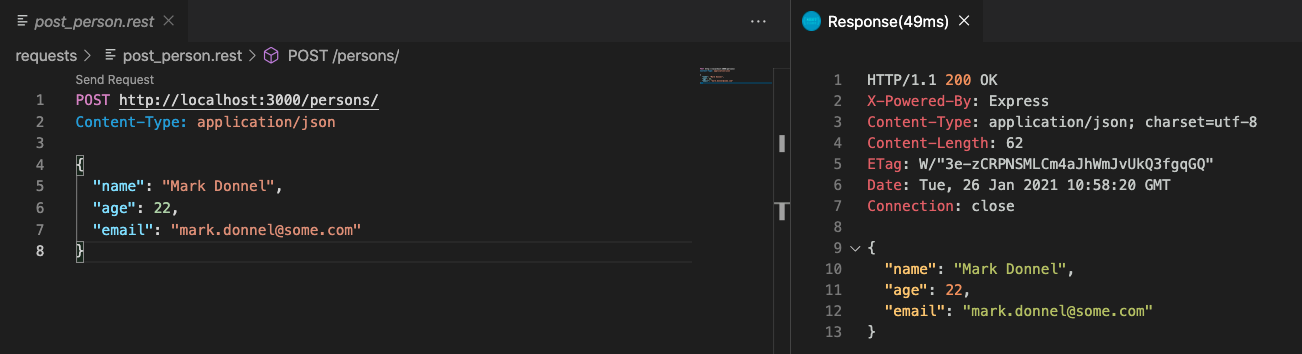
A below JSON data is visible in the console with console.log():
1 | |
You can create a small "error/mistake", for example set Content-Type: application/jso and notice what kind of error you will see (just remove one char at the end).
You can modify server POST route to display console.log(request.headers) to see what headers server will get.
1 2 3 4 5 6 7 8 | |
And you should notice that headers have mistake with content-type, now it is ending with jso and should be json.
Note
Old but good console.log() is working nicely also in the backend development!
VS Code debugging
You can also use VS Code debugging tools to debug your code.
Debug your Express app you will need to create a debugger configuration file launch.json for your Express application. Click on the Run icon in the Activity Bar and then the Configure gear icon at the top of the Run view to create a default launch.json file. Select the Node.js environment by ensuring that the type property in configurations is set to "node". When the file is first created, VS Code will look in package.json for a start script and will use that value as the program (which in this case is "${workspaceFolder}/index.js) for the Launch Program configuration.
1 2 3 4 5 6 7 8 9 10 11 12 13 14 15 16 17 | |
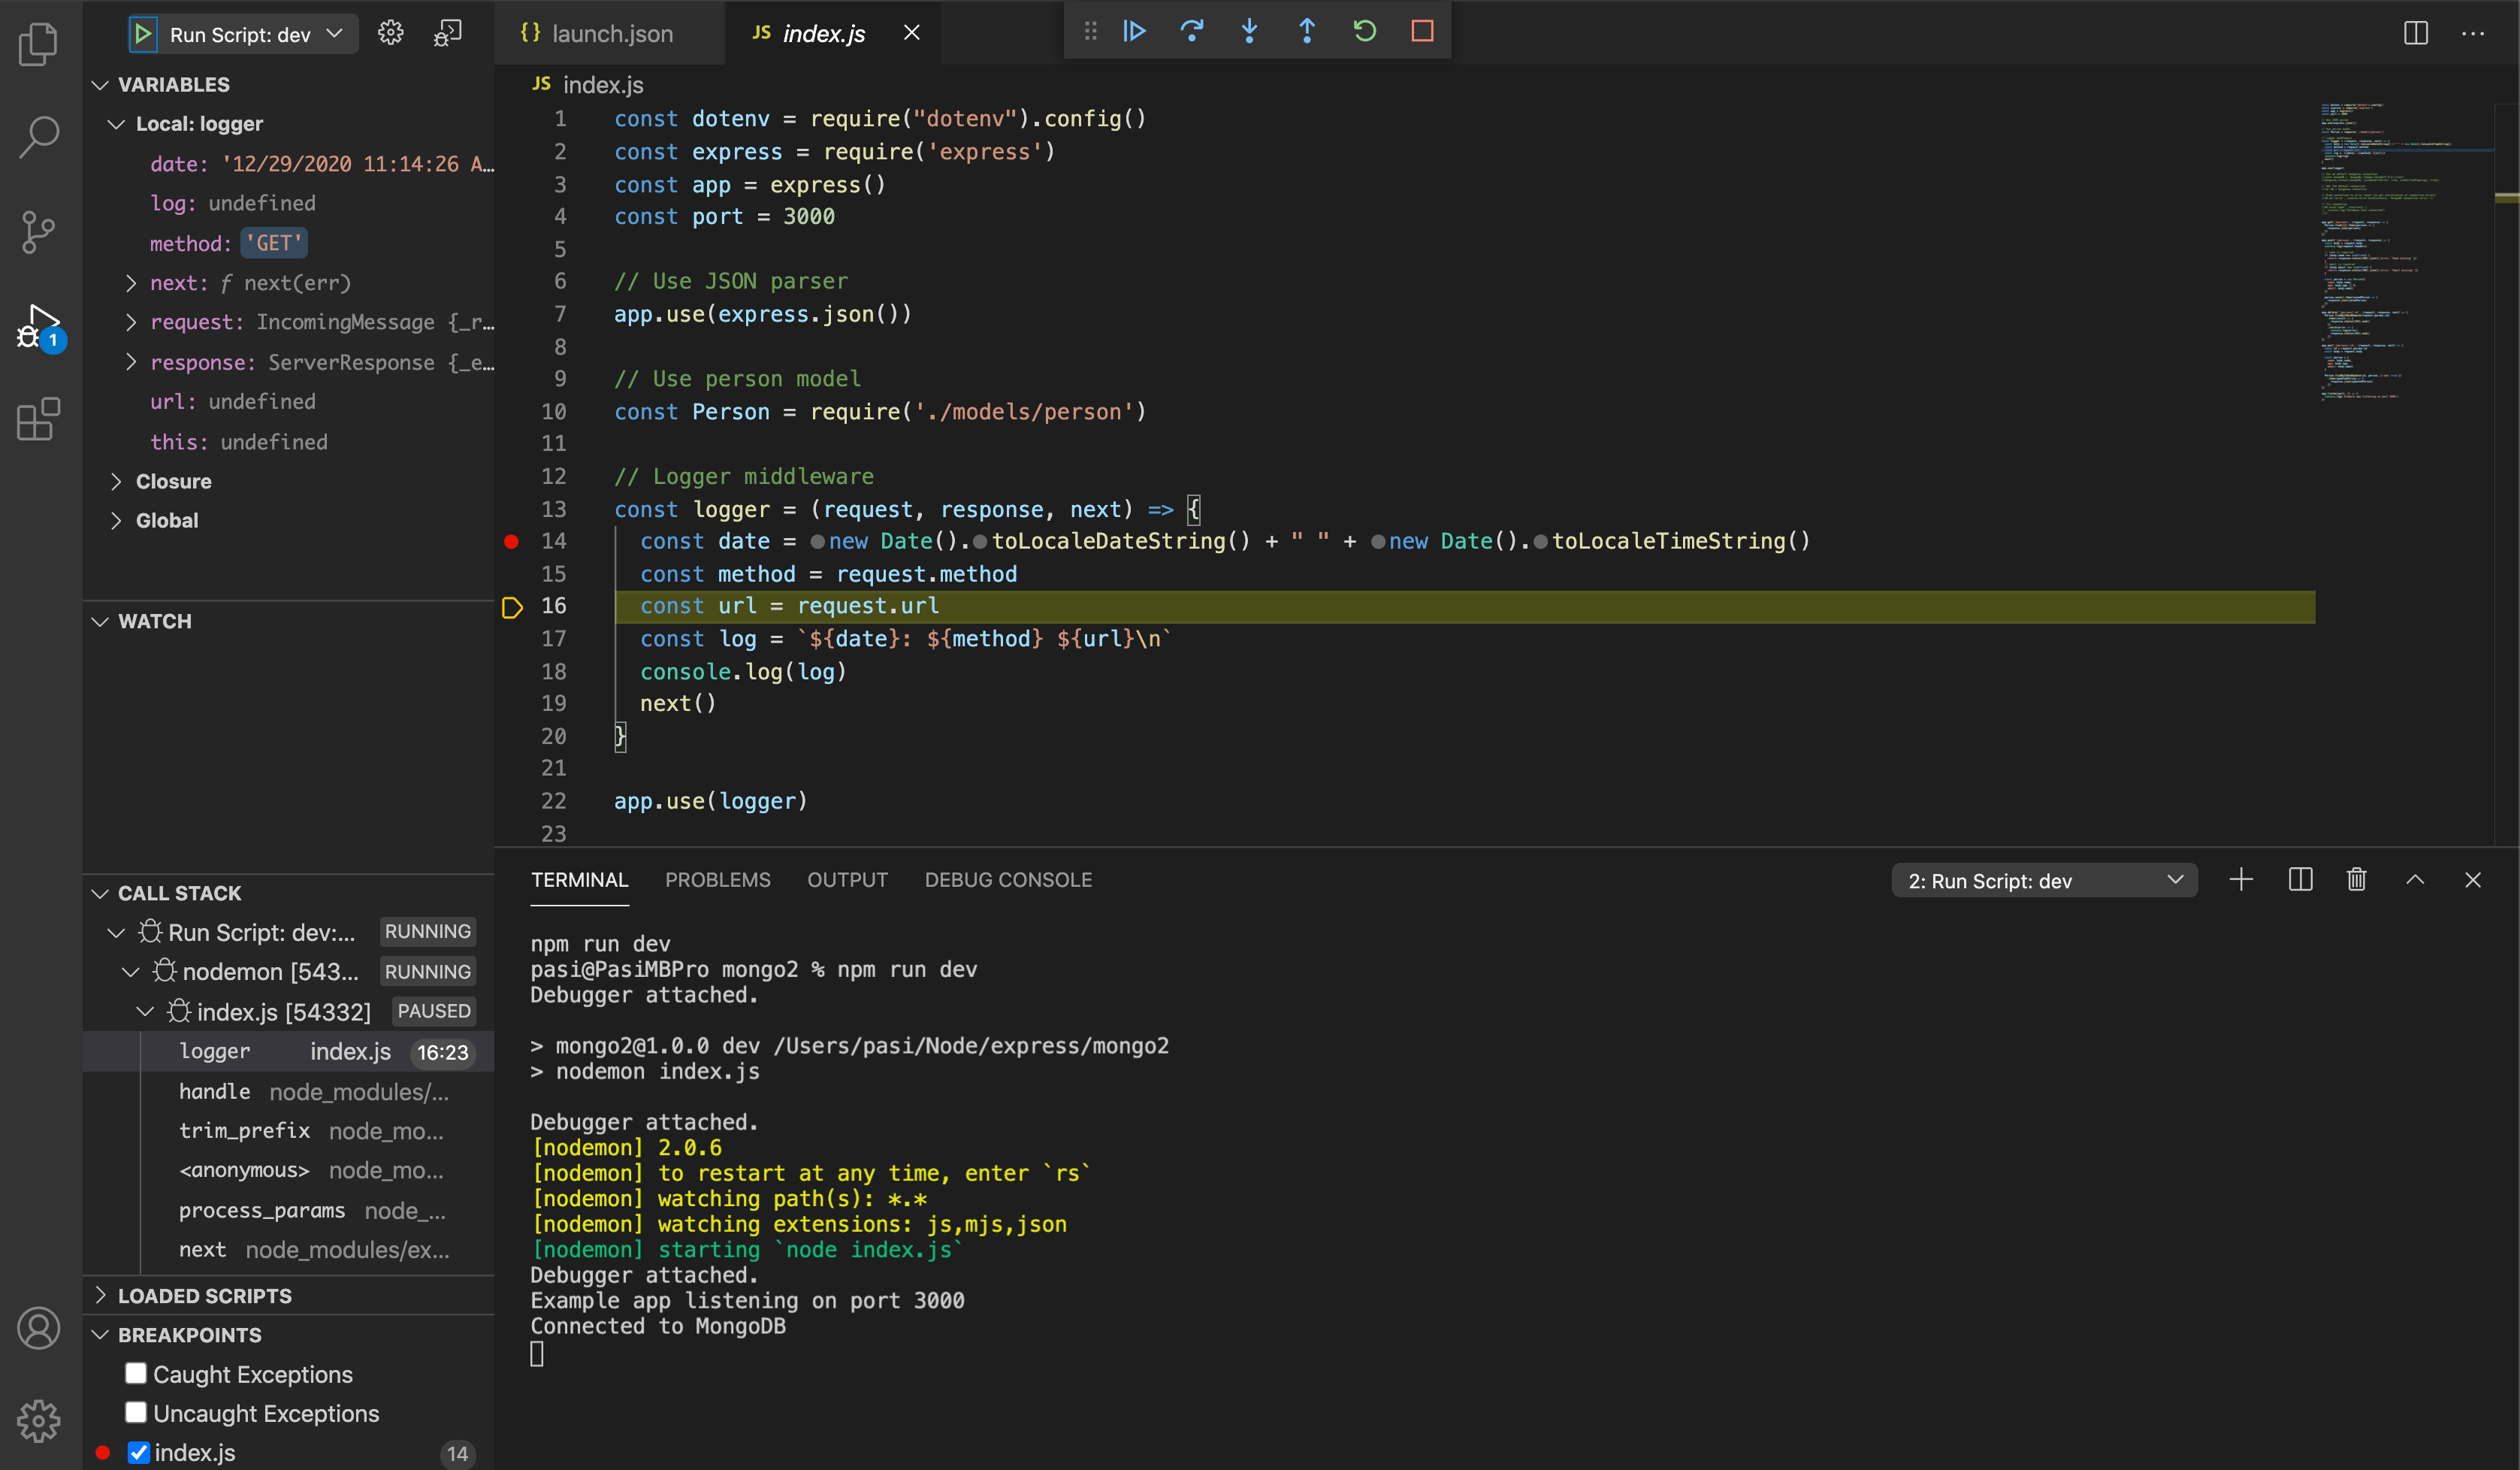
Save the new file and make sure Launch Program is selected in the configuration drop-down at the top of the Run view. Open index.js and set a breakpoint near the top of the file where the Express app object is created by clicking in the gutter to the left of the line number. Press F5 to start debugging the application. VS Code will start the server in a new terminal and hit the breakpoint we set. From there you can inspect variables, create watches, and step through your code.
Chrome Dev Tools
You can use Chrome debugger to debug Node.js/Express application.
Start your application with following command:
1 | |
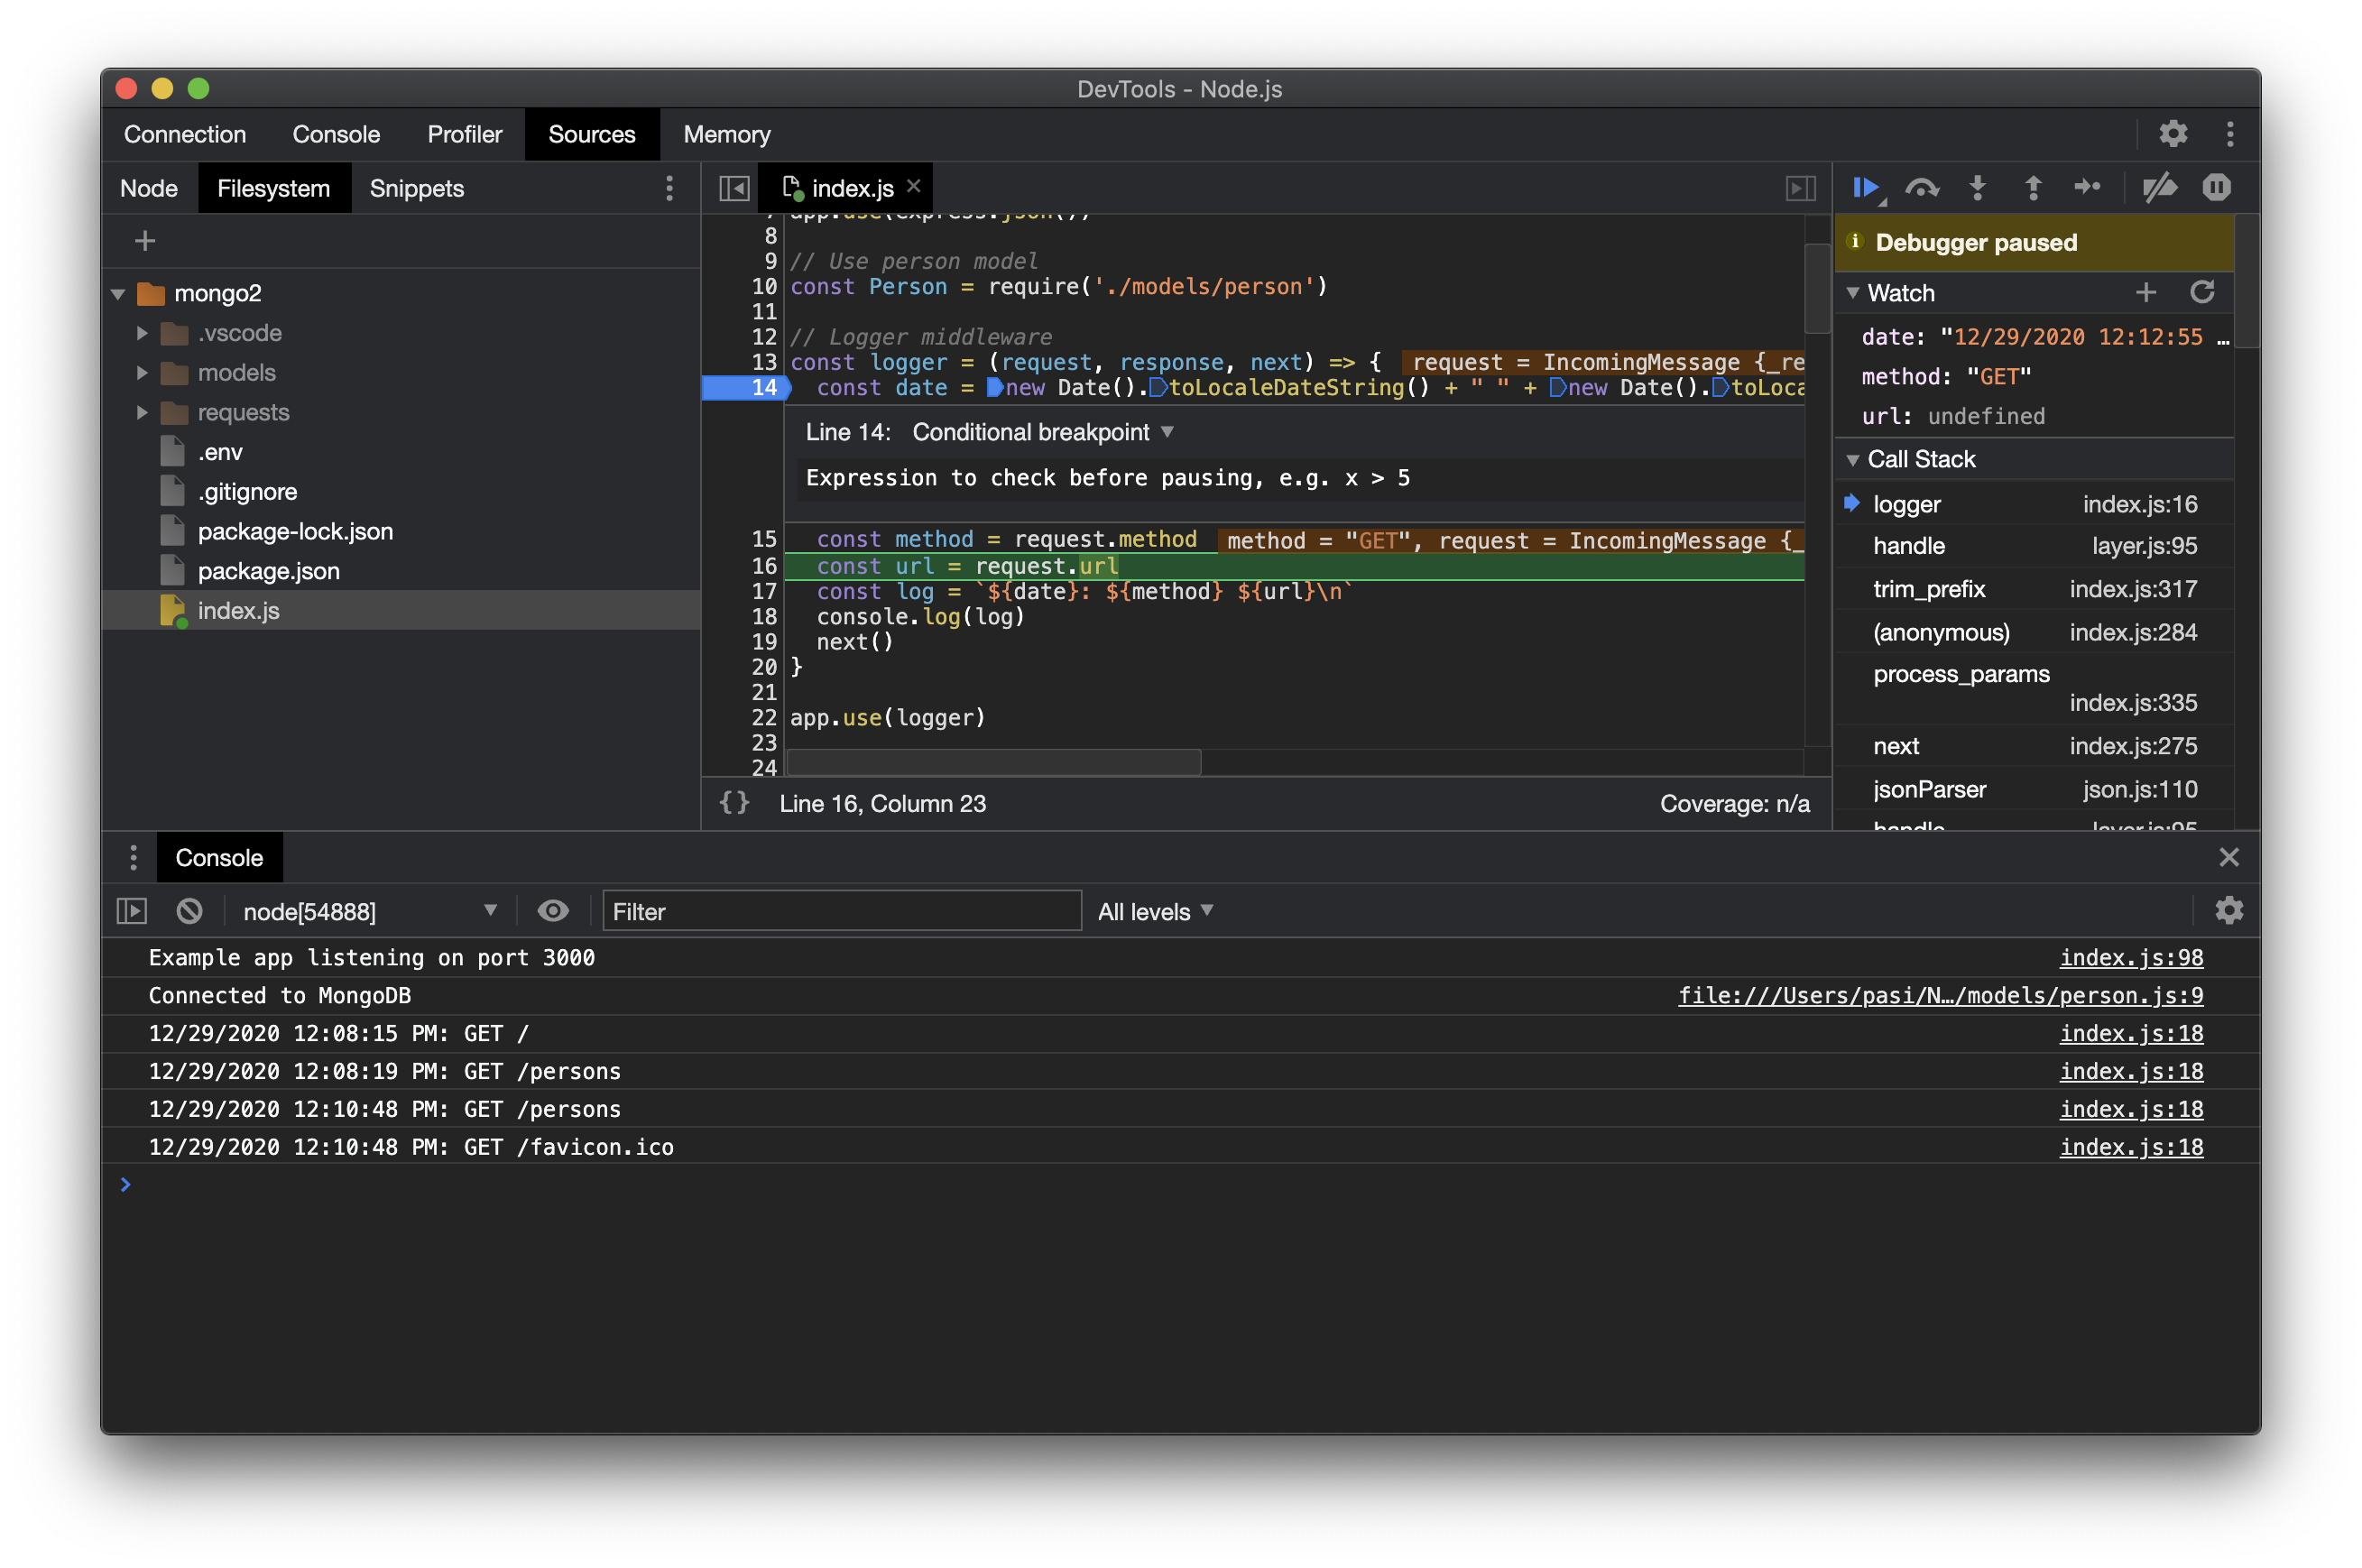
Open Chrome and click green Node icon in Chrome inspector. Select your Project to source folder and add needed breakpoints to your JavaScript files. Run your application in Chrome and start debugging.
Read more
Goals of this topic
Understand
- How to debug server side application.